Detailed Results in SCA
The Detailed Results tab shows information about detected vulnerabilities. To switch between the issues of different scans, use the scan list in the upper-right corner.
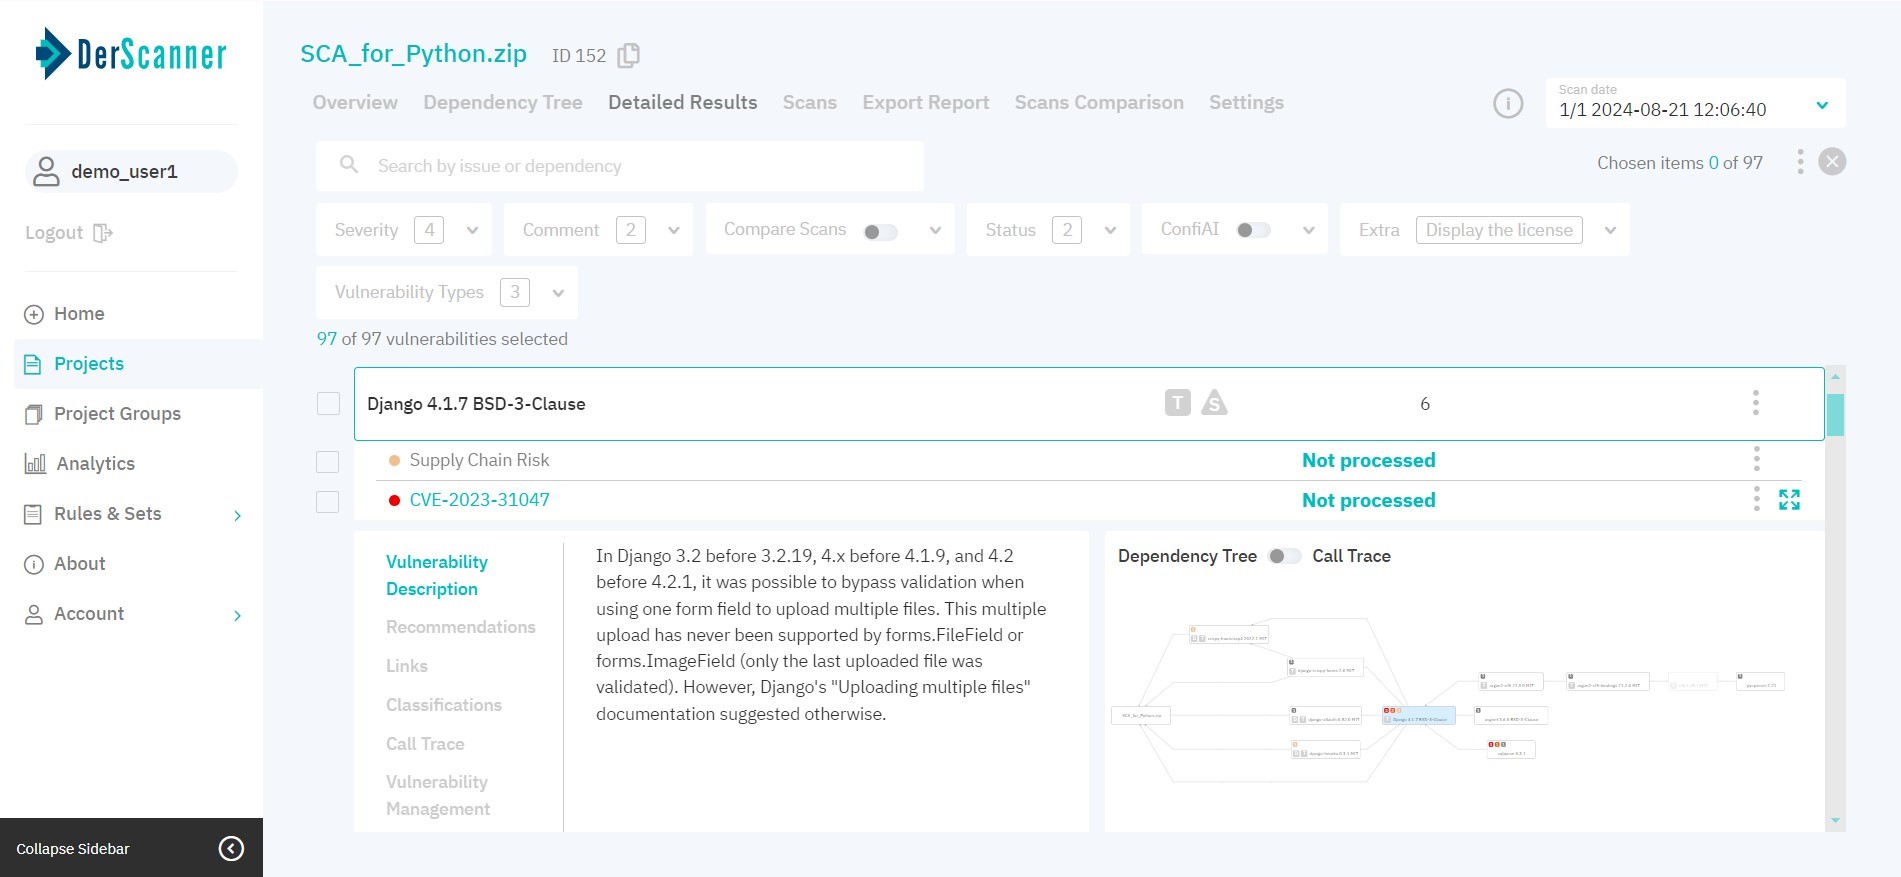
Figure 7.5: Detailed results
By default, vulnerabilities are grouped by library name and version. If a component has dependencies present, it will appear on the list with the corresponding tags: D for direct, and T for transitive dependencies. To learn more about transitive dependencies, place the cursor over the corresponding tag.
If a component has Supply Chain or License risks present, it will appear on the list with the corresponding tags: S for supply chain, and L for license risks. To learn more, click on the library name, and then click on the risk name in the list of entries that opens.
To facilitate navigation, type the vulnerability name or component in the search bar, or use filters.
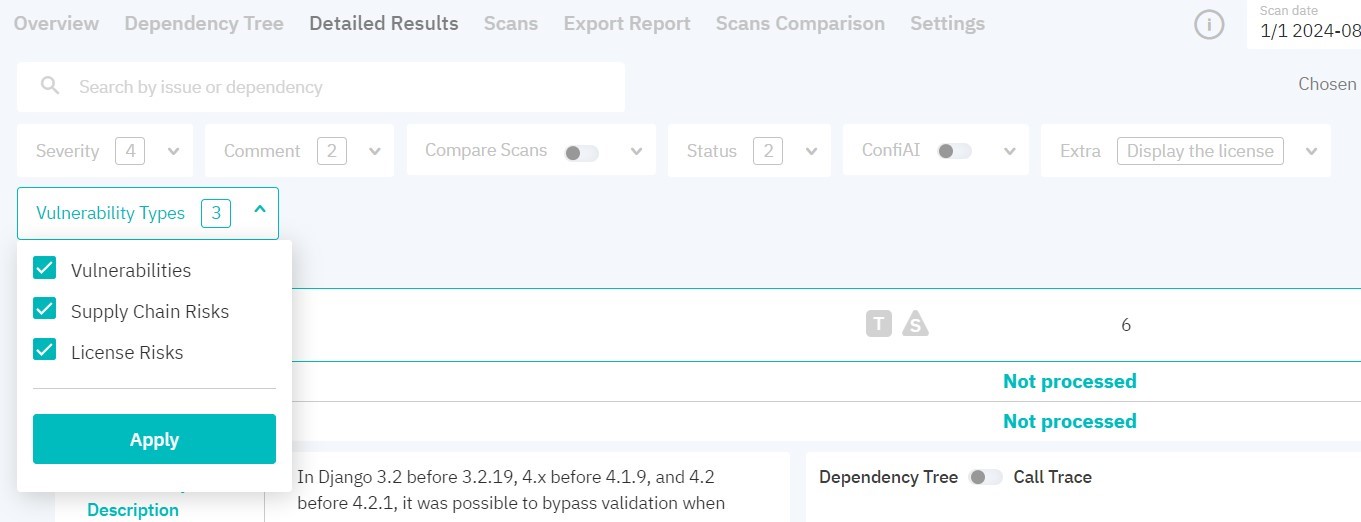
Figure 7.6: Results filters
You can filter results by the following parameters:
- severity
- comment
- status
- types:
- vulnerabilities
- supply chain risks
- license risks
- enable ConfiAI with one of the following modes:
- only true — displays vulnerabilities with a high likelihood of being true positives
- only important — displays vulnerabilities that need immediate attention
- custom — allows you to adjust the sensitivity of ConfiAI by moving a slider to different positions. The far-left position of the slider characterizes entries with the highest likelihood of correct detection, while the far-right position will display all entries
- dynamic — allows you to adjust the EPSS value by moving a slider to different positions. The far-left position (1) characterizes entries with the highest likelihood of exploitation, while the far-right position (0) will display vulnerabilities of any likelihood
- if there are two or more successful scans in a project, you can compare the current scan with any of the previous ones and display vulnerabilities according to status. To do this, select the appropriate settings:
- new — display new vulnerabilities compared to the scan selected from the list
- remaining — display the vulnerabilities found in both scans
- fixed — display vulnerabilities detected in the scan selected from the list but not found in the current scan
Filters will be applied after you click Apply.
By clicking on the three dots to the right of the vulnerability, you can change its severity level and status. When changing vulnerability status and severity level, security score is recalculated. Vulnerabilities with the Rejected status are not taken into account when calculating vulnerabilitynumber and security score. When rescanning, vulnerability statuses are saved.
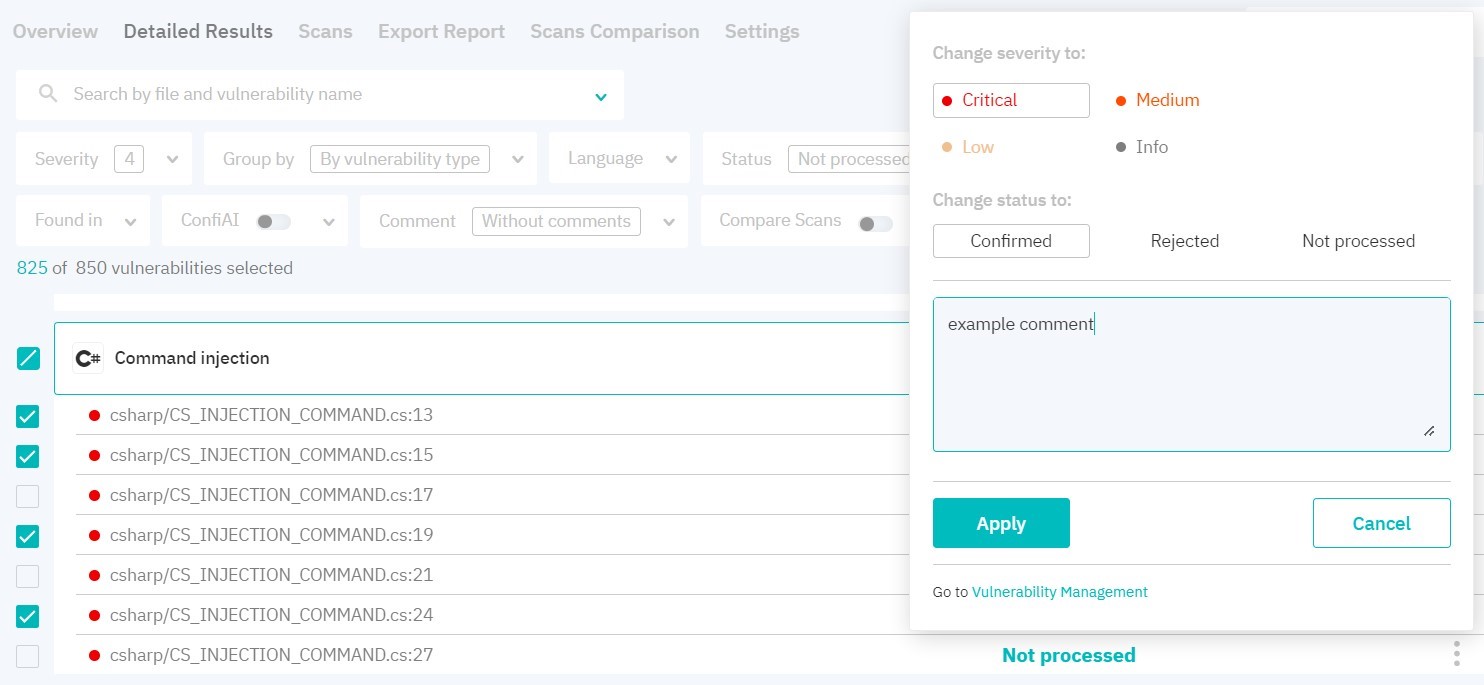
Figure 7.7: Vulnerabilities pack management
After choosing a certain vulnerability, the right part of the page displays the component’s dependency tree. To view information about the vulnerability in full screen, click the icon in the upper right corner, above the code fragment. On the left, the information about the vulnerability is provided: Description, Recommendations, Links, Classifications, Vulnerability Management, and Task Manager.

Figure 7.8: Vulnerability Properties
If the source code of the project was scanned together with the SBOM file, the list of component calls and imports will be available in the Call Trace tab. To view it, select an item on the call trace. Switching between the dependency tree view and the call trace view is performed via the toggle switch above the tree area.
For Supply Chain risks, the provided info includes Description with security score per metric breakdown, Vulnerability Management, and Task Manager.
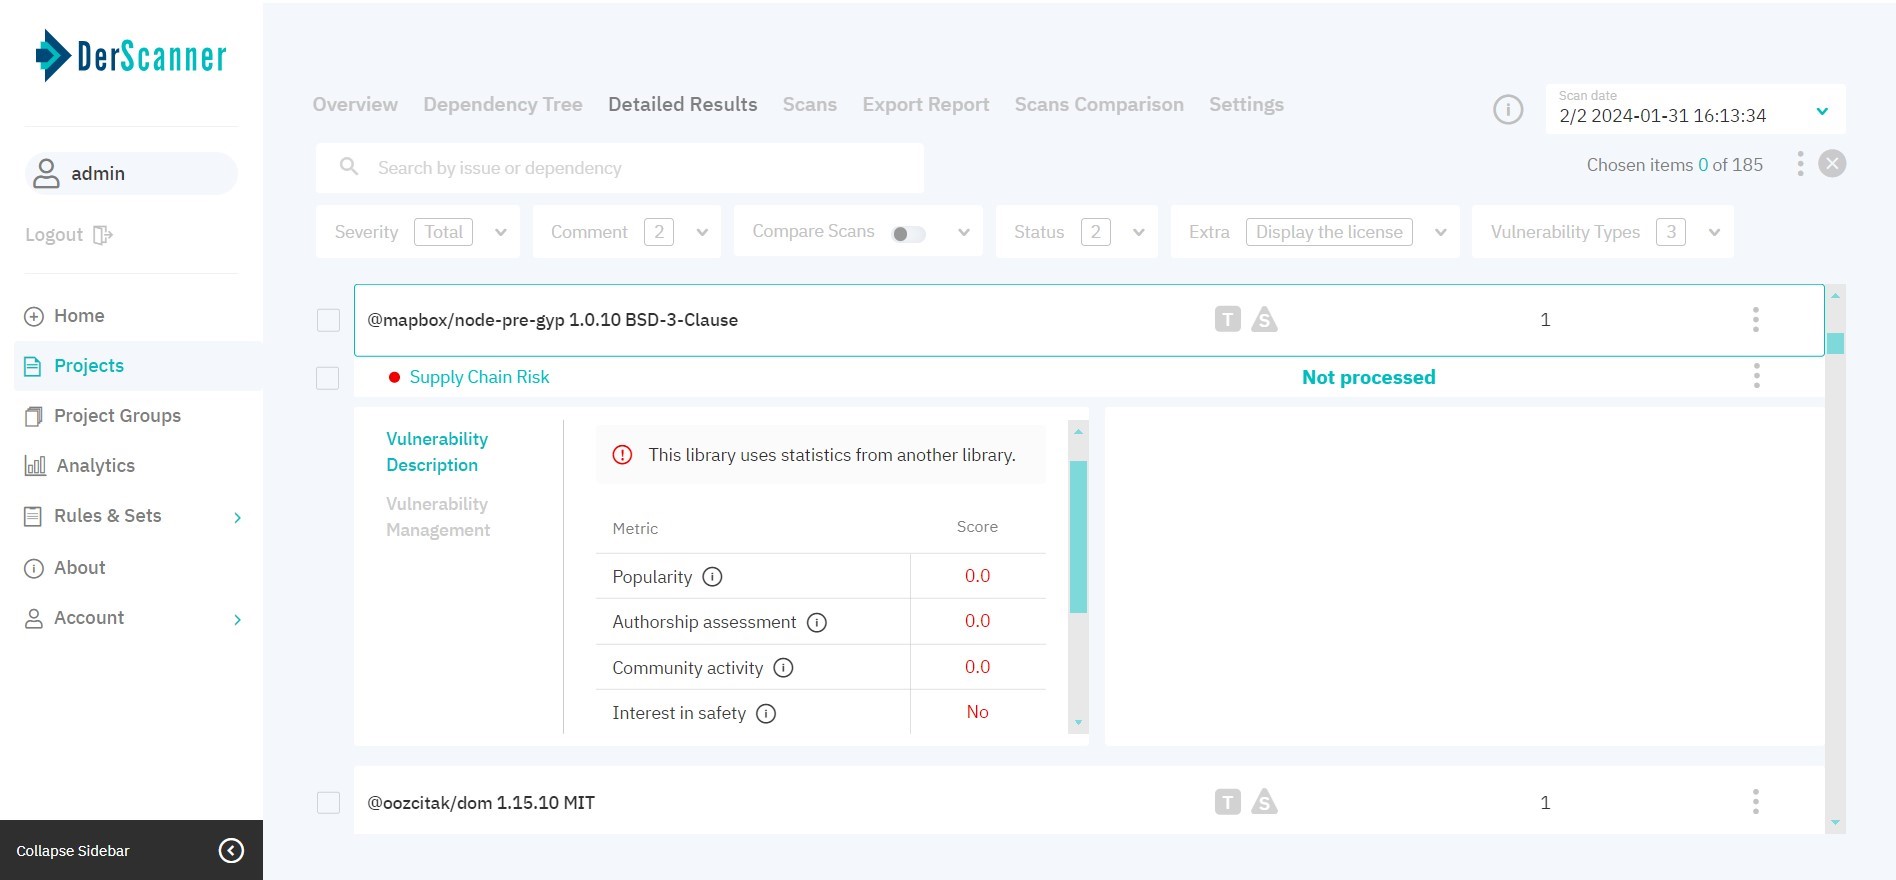
Figure 7.9: Supply Chain Security
For license risks, the provided info includes Description, Vulnerability Management, and Task Manager.
In the Vulnerability Management tab, you can change the severity level and status, add a comment to an entry, or view the event log with actions and comments left earlier.
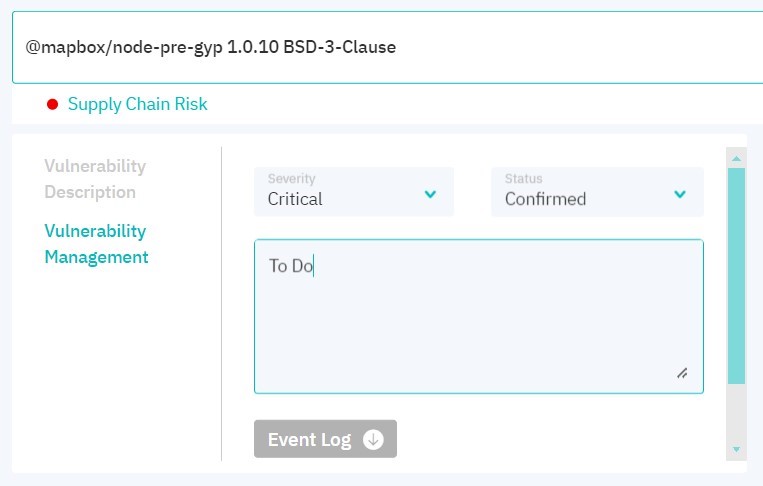
Figure 7.10: Vulnerability management
Apart from this, EPSS and CVSS scores for the entry are displayed. These parameters define confidence that this particular vulnerability can be exploited — a higher value corresponds to a lower probability of a false positive occurrence.